
The Influence of Oil-Related Narratives on the Stock Market on the Stock Market
Research Background and Objective
A narrative is an explanation of events. Narratives spread through conversations, newspapers, or social media and often stimulate emotions (Shiller, 2017). Some narratives are a response to explanation of an event like the Gulf War, some try to make sense of boarder changes in society like influenza epidemic in 1918, some may be fictional like the tooth fairy, and some may combine all three such as stories about Napoleon Bonaparte the French military leader. There are also economic narratives. They possibly one of the reasons that caused an economic event or perhaps emerged after it happened. For example, the Dotcom boom, the emerging of new technology, or the 2008/9 financial crisis.
In financial markets some narratives may affect prices. In modern finance theory information is central of efficient financial market. The degree to which relevant information affects investors’ action has been a central concern of financial economics since the efficient market hypothesis (EMH) by Fama (1970). In its strong form EMH states that all available information that may affect future returns is incorporated into stock prices almost immediately, and on average investors act rationally eliminating unexploited trading opportunities. Thus, both relevant and irrelevant news put pressure on stock prices once published in the media for short period, and then prices are expected to reverse to their fundamental value because of information flows. However, Malkiel (2003) shows how diverging market sentiment, including how behavioral and psychological elements influence stock prices. Indeed not all market participants are rational, and price movement is idiosyncratic to the market when there is a public events (Roll, 1988). Only one third of relevant public news is incorporated due to possibly behavioral biases or overreaction to certain narratives (see Cutler et al. (1988)). As a result, irrational investors or noise traders may be susceptible to spread of narratives that contain irrelevant news or major news events that would cause the market prices extremely fluctuate. This study draws from the idea proposed by Shiller (2017) that narratives spread contagiously and cause economic fluctuations.
News may amplify events by spreading narratives and influencing investors thinking and actions that drive economic and financial fluctuations (Shiller (2017), Shiller (2000)). A narrative might consist of one or more news topics and it often portrayed differently across media overtime. Media convey narratives that could be contagious by transferring stories from investor to another, or from country to country like a contagious disease. As noted by Shiller (2000, p.101) “Significant market events generally only occur if there is similar thinking among large groups of people, and the news media are essential vehicles for the spread of ideas”. Recent literature examined the effect of media sentiment on the stock market by tone of news (positive verses negative words) or by types of financial news (such as mergers and acquisitions, analyst recommendations, stock splits, etc.) (e.g. see Boudoukh et al. (2013), Tetlock (2007)) without analyzing spread of certain stories or which story has the most significant influence. Epidemic-like narratives or “go viral” where the news spur investors’ emotions and generate seemingly unpredictable fluctuations in the market activity.
When there is a story that many people are talking or writing about for some time, the likelihood of a speculative bubble is high or also could be a cause for a speculative bubble to burst. Shiller’s description of a speculative bubble can be understood as a social epidemic whose contagion is shown by asset prices. Price increases are encouraged by the spread of success narratives, and thus attract more people into the market and further increase prices. Positive feedback is again associated with narratives that fuel a bubble’s growth. However reverse direction to the same contagious process occurs once bubble bursts, and price falling makes more and more people exist the market creating pessimistic news about the economy (Akerlof and Shiller, 2010). The growth of epidemic depends on speed rate of contagion. If attention is given by news media to some events, the contagion speed rate becomes higher (Shiller et al., 1984).
Such transmission process has been examined and predicted using mathematical models in various fields. The most popular model is susceptible – infected – recovered/removed (SIR) model developed by Kermack and McKendrick (1932) which has been used to explain propagation of diseases, computer viruses, psychological behaviour, marketing and economics. For example, they are extensively used in medicine for the purpose of studying the outbreaks of infectious diseases such as influenza, cholera, HIV/AIDS, Syphilis and others (e.g. Rachah and Torres (2016), Li and Ma (2007), Hooten et al. (2010)); in computer science, modelling the spread of computer viruses on the internet (Han and Tan, 2010); in psychology, for studying the behaviour of individuals in response to others when they use different social media platforms such as Twitter and MySpace (Cannarella and Spechler, 2014); in marketing, understanding the behaviour of viral distribution of advertisements (Rodrigues and Fonseca, 2016, Rodrigues and Fonseca, 2015); in economics and finance, for studying the transmission of financial crises between countries (Garas et al., 2010), predicting cryptocurrencies price from spread of news in social online forums (Phillips and Gorse, 2017) using Hidden Markov Model (HMM) another model that is associated with epidemiology.
Due to the importance of oil prices to the global economy among investors, narratives about oil may influence stock markets, this research aims to examine this effect. Oil price could be a good candidate in studying spread of narratives into stock markets for two reasons. Firstly, oil prices affect many countries’ stock markets. Many studies have shown the dynamic relationship between oil and stock prices, as an example Park and Ratti (2008) examine US and 13 European countries, and Ramos and Veiga (2013) also found asymmetric relationship in 34 countries. Furthermore, oil-stock returns relationship depends if the country is net oil exporter or net importer. The general assumption is that oil exporter country would benefit from raising oil prices because it will increase country’s income, while it could be negative for oil-importing country (see studies that found this relationship is true (Park and Ratti, 2008, Arouri and Rault, 2012, Bjørnland, 2009)). Secondly, because oil price volatility affects many sectors, given that oil price is a major factor in production cost in many sectors. Nandha and Faff (2008) examine 35 industries around the world, and found negative impact on 32 industries, while Elyasiani et al. (2011) shows that oil price shocks affect nine industries out if thirteen in US stock market.
There are several factors are often considered to be responsible for influencing oil prices. Factors are supply and demand shocks, geopolitical tension, financial crises, and OPEC’s role in oil market (Hamilton, 2011, Hamilton, 2009). However, some factors may provoke each other. Oil prices like every other commodity is driven by supply and demand shocks, and each shock likely to have different dynamic effect on the price of oil as well as the economy because of the underlying effect on the shock (Kilian, 2009). For example, the underlying cause of supply and demand shocks can be exogenous, such as war or economic instability. Kilian and Park (2009) show that in the US, industry-specific stock reaction to the oil demand shocks depends on the underlying cause of the shock. Such mining industry appreciate in response to positive demand shock, whereas the petroleum and natural gas industry remain unaffected, and the automobile and retail deprecate considerably. In contrast, if the same demand increase in oil prices is driven by development to global real economic activity, the share prices of all industries would be affected to a different degree. Moreover, historically disruptions of crude oil productions are led by exogenous political events such as 1973 oil crises and 1988 the Iran-Iraq war. Thus, newspapers articles associated with crude oil may contain more than one factor narrative.
As a result, those factors might create narratives that spread contagiously via the media into stock markets and in turn could influence investors’ decision making. The theoretical relationship between oil price and stock market return as described by Smyth and Narayan (2018) could be positive or negative. On one hand, crude oil price influences stock markets (Jones and Kaul, 1996) through both shocks to supply and demand or uncertainty about the oil market. Uncertainty about future oil supply shortfalls, generate a negative relationship between oil prices and stock returns, while higher oil prices, causing from an unanticipated global expansion, has a positive effect on stock returns (Kilian and Park, 2009). One the other hand, oil-stock return relationship varies over time during periods associated with economic volatility of booms and recessions. This volatility is likely caused by either financial crises or external events, such as the GFC or wars (Tsai, 2015, Cameron and Schnusenberg, 2009). Similarly, OPEC has an important role in the oil market. Its share production account for around 40 percent from 2008 till 2018 and approximately 80 percent of crude oil reserves (OPEC, 2017), its decisions therefore, may have a significant impact on the oil market and ultimately the stock market (Guidi et al., 2006). While oil-related news significantly affects stock market prices, and thus have heterogeneous effects on investor’s profit (Narayan and Narayan, 2017). This research is an investigation of the epidemiology of narratives through mainstream media relevant to crude oil prices and stock market, by asking to what extent are oil narratives informative for describing stock market fluctuations. In addition, which of these oil-related narratives spread and affect the stock market.
Table of Contents
Key Questions and Contribution
The purpose of this study is to answer these main questions:
- How are oil-related narratives determined?
- Has the narrative around oil changed over time and across countries?
- Do oil-related narratives affect the oil market?
- Do oil-related narratives affect the stock market?
- What determines whether a particular narrative affects traders?
Understanding the contagious behaviour of narratives will help answer the above questions that aim to accomplish the following objectives:
- Expand the body of news media effect on stock market literature by incorporating not only the tone of news and type but also which of these news are contagious and has more effect than others.
- Purpose an model derived from epidemiology literature that can help predict stock market returns from narratives.
- Examine the oil-stock returns relationship by using different method of applying textual analysis other than sentiment.
Data and Methodology
The methodology will compromise of three steps. First, applying textual analysis on oil- related newspapers articles used in Natural Language Processing (NLP) literature to clean and reduce row text obtained from newspapers articles before estimation (Gentzkow et al., 2017). In order to obtain oil-specific newspaper articles “crude oil” and “petroleum” topic tags searches. Then cleaned data are decomposed into oil news topics (the topics are going to be identified and classified from oil price literature over the years) using Latent Dirichlet Allocation (LDA) model (Blei et al., 2003).
The second step use epidemic model to identify which of these oil-related topics spread contagiously and affect the stock market returns. Normally in studying an infectious disease there are two types of models are used (Figure 1 below shows the difference between epidemic models):
- Stochastic models (e.g. Markov chain) rely on among-individual chance variations in risks exposure, diseases and other factors i.e. allowing heterogeneity in population— they are very hard to set up as they need more data and many simulations to yield useful prediction. Good for small population.
- Deterministic models (compartmental models) different variations of SIR model, attempt to describe and explain what happens on the average at the population scale. The population is divided into smaller classes/compartments susceptible (S) -infected (I) – recovered/removed
(R) as each class represents a specific stage of the epidemic at time
t. The basic SIR model equation as follows:
dSdt = -βS IN
(1)
dIdt = βS IN -γI
(2)
dIdt = γI
(3)
Most studies use deterministic models because they require less data and relatively easy to set up. They are particularly useful for large population studies. There are limitations in applying this type of models to this kind of study. First, the model requires variables very difficult to assume in this research e.g. infection rate
β
and recovery rate
γ
. Secondly, there are many configurations to this model that has been recognised in epidemiology literature that very difficult to choose which one is suited to this study.
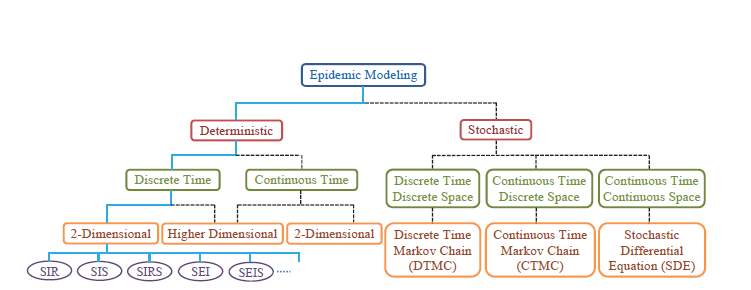 Figure 1 Classification of various classes of epidemic models (obtained from Dadlani (2013). Notes: (S) denotes Susceptible-(I) infected-(R) removed/recovered, and (E) exposed.
Data will be obtained from secondary sources. Those sources will be generally publicly available from newspapers archives or dataset archives such as Proquest newsstand. Newspapers articles will be obtained for United States and Canada from 1984-present from Proquest newsstand database. Number of articles were collected as a sample using word “OPEC” providing more than 25000 articles for both countries. As a third country for the study Saudi Arabian articles were collected from two newspapers (Alhayat and Aljazirah) own online archives using words “oil & OPEC” in Arabic starting from 1998-present providing around 27000 articles. Those newspapers were chosen because of their long data periods. Yearly average number of articles weighted for all countries is shown in figure 2.
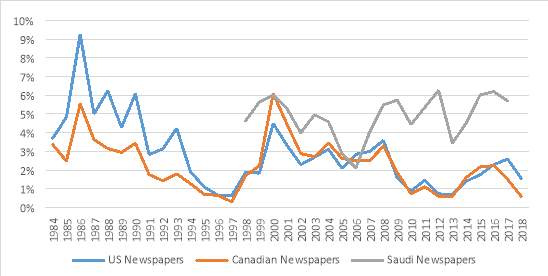 Figure 2 Yearly weighted average number of articles using words “OPEC” and “Oil” for all countries.
Notes:Data retrieved from Proquest for US and Canada and for Saudi Arabia from Alhayat and Aljazirah own online archives. The word “OPEC” is used for US and Canada, but words “oil” and “OPEC” in Arabic.
Research Timetable
| Time | Objective |
| August 2018 – August 2019 (Year 1) |
|
| May 2019 – May 2020 (Year 2) |
|
| May 2020 – May 2021 (Year 3) |
|
Reference
AKERLOF, G. A. & SHILLER, R. J. 2010. Animal spirits: How human psychology drives the economy, and why it matters for global capitalism, Princeton university press.
AROURI, M. E. H. & RAULT, C. 2012. OIL PRICES AND STOCK MARKETS IN GCC COUNTRIES: EMPIRICAL EVIDENCE FROM PANEL ANALYSIS. International Journal of Finance & Economics, 17, 242-253.
BJØRNLAND, H. C. 2009. OIL PRICE SHOCKS AND STOCK MARKET BOOMS IN AN OIL EXPORTING COUNTRY. Scottish Journal of Political Economy, 56, 232-254.
BLEI, D. M., NG, A. Y. & JORDAN, M. I. 2003. Latent dirichlet allocation. Journal of machine Learning research, 3, 993-1022.
BOUDOUKH, J., FELDMAN, R., KOGAN, S. & RICHARDSON, M. 2013. Which news moves stock prices? a textual analysis. National Bureau of Economic Research.
CAMERON, K. & SCHNUSENBERG, O. 2009. Oil prices, SUVs, and Iraq: An investigation of automobile manufacturer oil price sensitivity. Energy Economics, 31, 375-381.
CANNARELLA, J. & SPECHLER, J. A. 2014. Epidemiological modeling of online social network dynamics. arXiv preprint arXiv:1401.4208.
CUTLER, D. M., POTERBA, J. M. & SUMMERS, L. H. 1988. What moves stock prices? : National Bureau of Economic Research Cambridge, Mass., USA.
DADLANI, A. 2013. Deterministic Models in Epidemiology: from Modeling to Implementation.
ELYASIANI, E., MANSUR, I. & ODUSAMI, B. 2011. Oil price shocks and industry stock returns. Energy Economics, 33, 966-974.
FAMA, E. F. 1970. Efficient capital markets: A review of theory and empirical work. The journal of Finance, 25, 383-417.
GARAS, A., ARGYRAKIS, P., ROZENBLAT, C., TOMASSINI, M. & HAVLIN, S. 2010. Worldwide spreading of economic crisis. New journal of Physics, 12, 113043.
GENTZKOW, M., KELLY, B. T. & TADDY, M. 2017. Text as data. National Bureau of Economic Research.
GUIDI, M. G., RUSSELL, A. & TARBERT, H. 2006. The effect of OPEC policy decisions on oil and stock prices. OPEC review, 30, 1-18.
HAMILTON, J. D. 2009. Causes and Consequences of the Oil Shock of 2007-08. National Bureau of Economic Research.
HAMILTON, J. D. 2011. Historical oil shocks. National Bureau of Economic Research.
HAN, X. & TAN, Q. 2010. Dynamical behavior of computer virus on Internet. Applied Mathematics and Computation, 217, 2520-2526.
HOOTEN, M. B., ANDERSON, J. & WALLER, L. A. 2010. Assessing North American influenza dynamics with a statistical SIRS model. Spatial and spatio-temporal epidemiology, 1, 177-185.
JONES, C. M. & KAUL, G. 1996. Oil and the stock markets. The journal of Finance, 51, 463-491.
KERMACK, W. O. & MCKENDRICK, A. G. 1932. Contributions to the mathematical theory of epidemics. II.—The problem of endemicity. Proc. R. Soc. Lond. A, 138, 55-83.
KILIAN, L. 2009. Not all oil price shocks are alike: Disentangling demand and supply shocks in the crude oil market. American Economic Review, 99, 1053-69.
KILIAN, L. & PARK, C. 2009. THE IMPACT OF OIL PRICE SHOCKS ON THE U.S. STOCK MARKET*. International Economic Review, 50, 1267-1287.
LI, D. & MA, W. 2007. Asymptotic properties of a HIV-1 infection model with time delay. Journal of Mathematical Analysis and Applications, 335, 683-691.
MALKIEL, B. G. 2003. The efficient market hypothesis and its critics. Journal of economic perspectives, 17,59-82.
NANDHA, M. & FAFF, R. 2008. Does oil move equity prices? A global view. Energy Economics, 30, 986-997.
NARAYAN, S. & NARAYAN, P. K. 2017. Are Oil Price News Headlines Statistically and Economically Significant for Investors? Journal of Behavioral Finance, 18, 258-270.
OPEC 2017. Annual Statistical Bulletin.
PARK, J. & RATTI, R. A. 2008. Oil price shocks and stock markets in the U.S. and 13 European countries. Energy Economics, 30, 2587-2608.
PHILLIPS, R. C. & GORSE, D. Predicting cryptocurrency price bubbles using social media data and epidemic modelling. Computational Intelligence (SSCI), 2017 IEEE Symposium Series on, 2017. IEEE, 1-7.
RACHAH, A. & TORRES, D. F. 2016. Modeling, dynamics and optimal control of Ebola virus spread. arXiv preprint arXiv:1603.05794.
RAMOS, S. B. & VEIGA, H. 2013. Oil price asymmetric effects: Answering the puzzle in international stock markets. Energy Economics, 38, 136-145.
RODRIGUES, H. S. & FONSECA, M. J. 2015. Viral marketing as epidemiological model. arXiv preprint arXiv:1507.06986.
RODRIGUES, H. S. & FONSECA, M. J. 2016. Can information be spread as a virus? Viral marketing as epidemiological model. Mathematical Methods in the Applied Sciences, 39, 4780-4786.
ROLL, R. 1988. R-S1-2. Journal of finance, 43, 541-566.
SHILLER, R. C. 2000. Irrational exuberance. Philosophy & Public Policy Quarterly, 20, 18-23.
SHILLER, R. J. 2017. Narrative economics. American Economic Review, 107, 967-1004.
SHILLER, R. J., FISCHER, S. & FRIEDMAN, B. M. 1984. Stock prices and social dynamics. Brookings papers on economic activity, 1984, 457-510.
SMYTH, R. & NARAYAN, P. K. 2018. What do we know about oil prices and stock returns? International Review of Financial Analysis, 57, 148-156.
TETLOCK, P. C. 2007. Giving content to investor sentiment: The role of media in the stock market. The Journal of finance, 62, 1139-1168.
TSAI, C.-L. 2015. How do U.S. stock returns respond differently to oil price shocks pre-crisis, within the financial crisis, and post-crisis? Energy Economics, 50, 47-62.
What Students Are Saying About Us
.......... Customer ID: 12*** | Rating: ⭐⭐⭐⭐⭐"Honestly, I was afraid to send my paper to you, but you proved you are a trustworthy service. My essay was done in less than a day, and I received a brilliant piece. I didn’t even believe it was my essay at first 🙂 Great job, thank you!"
.......... Customer ID: 11***| Rating: ⭐⭐⭐⭐⭐
"This company is the best there is. They saved me so many times, I cannot even keep count. Now I recommend it to all my friends, and none of them have complained about it. The writers here are excellent."
“Order a custom Paper on Similar Assignment at essayfount.com! No Plagiarism! Enjoy 20% Discount!”
